 how-to
How to Track Comic Book Price Trends in 2026
Last Updated: October 27, 2026
Quick Summary
To track comic book price trends, log completed sales rather than asking prices, record each sale's exact grade and condition, and compare medians within the same grade over time. Use at least several sales per book before drawing conclusions. This separates real market movement from changes in grade mix.
- Record completed sales, not asking prices, since a completed sale shows what a buyer actually paid.
- Keep raw and slabbed sales in separate tabs to avoid mistaking grade-mix shifts for price changes.
- Use the median rather than the mean to resist distortion from a single bidding war or outlier.
- Treat a trend as weak if it rests on fewer than five sales in the same grade.
- Recalculate the median without the top sale; if the trend disappears, it was an outlier.
Table of Contents
- Step 1: Set Up Your Comic Book Collection App or Tracker
- Step 2: Pull Completed Sales History for Each Book
- Step 3: Build a Price Tracking Spreadsheet With Grade and Condition Columns
- Step 4: Separate Real Price Movement From Grade and Condition Changes
- Step 5: Calculate Trend Metrics and Check How Confident the Data Is
- How to Check Comic Book Values Before You Act on a Trend
- Your Next Step: Start Tracking Your Collection This Month
- Frequently Asked Questions
Comic book prices can swing hard in a single month, and a lot of collectors only notice after the fact. Collectors can use record-keeping habits to track those shifts.
The core idea is simple: a price trend is only as good as the sales behind it. A single eye-popping auction result tells you very little. A pattern across many completed sales, matched by grade and condition, tells you something real.
Most collectors skip this work. They check one listing, see a number, and assume the market moved. That habit is why so many people buy at the top and sell at the bottom.
What a tracking system gives you:
- A record of what books actually sold for, not what sellers are asking
- Clear comparisons between grades and conditions
- A way to track price trends
- Proof of your reasoning when you decide to buy or sell
Step 1: Set Up Your Comic Book Collection App or Tracker
Start with one place to keep your data. A comic book collection app or a simple spreadsheet both work. The key is that every book gets a row, and you update it the same way each time.
Pick a tool that lets you store a title, issue number, grade, and purchase price. Many collectors start with a free option and move up only when they outgrow it.
Set a regular review date, such as the first Monday of each month. Consistency matters more than tool choice.
Step 2: Pull Completed Sales History for Each Book
Completed sales beat asking prices every time. An asking price is what a seller hopes to get. A completed sale is what a buyer actually paid.
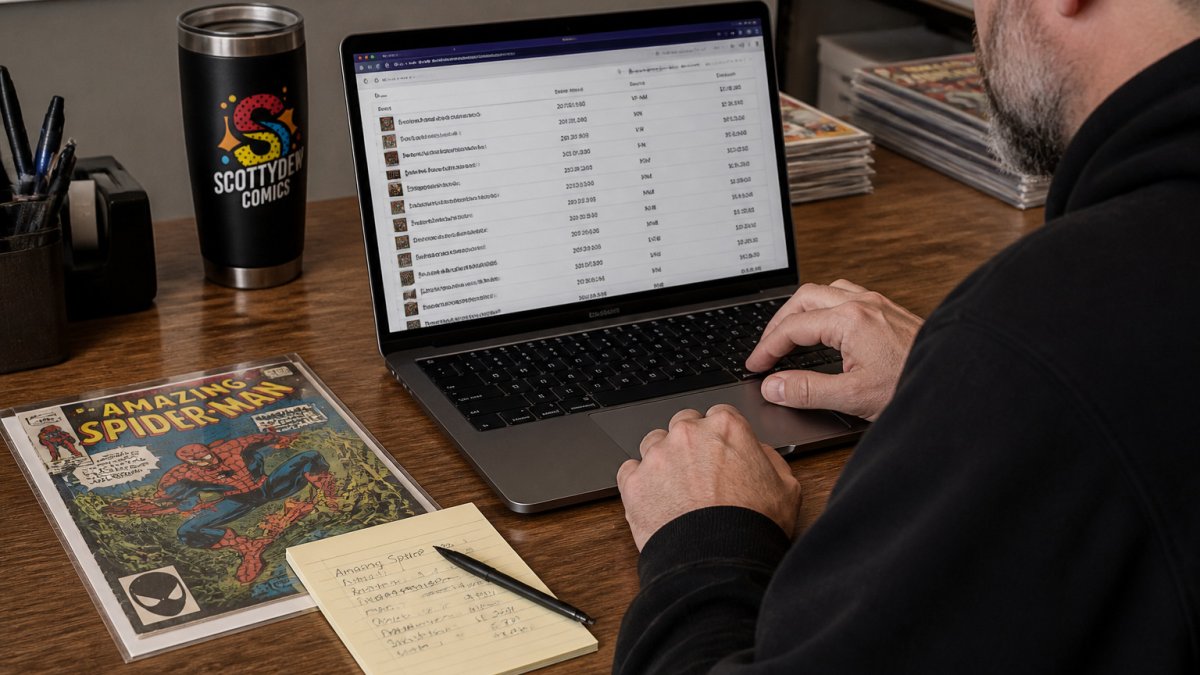
Look up sold listings on major marketplaces and auction records. For each sale, note the date, the sale price, the grade, and whether the book was raw or slabbed.
Collect at least several recent sales per book before you draw any conclusions. For guidance on where and how to find reliable market data, see researching comic book market history.
The real challenge here is checking the grade. Two copies of the same issue can differ by several grade points, and that gap can move the price more than any market trend. Record exact grades, not rough guesses.
Step 3: Build a Price Tracking Spreadsheet With Grade and Condition Columns
A spreadsheet gives you control that an app sometimes cannot, and it is the piece most tracking guides skip. If you are unsure how the grade categories are defined, this collector's guide to grading comics explains the scale. Below is a standardized log you can copy into Google Sheets or Excel today. The goal is not to collect data, it is to collect data you can compare without second-guessing yourself later.
Set up these columns, in this order:
- Book ID, a short code like
ASM-300so you can sort and filter without retyping titles - Title and issue number
- Sale date, the date the auction closed or the listing sold, not the date you found it
- Sale price (USD), the hammer price or Buy It Now price, before tax and shipping
- Shipping charged (USD), what the buyer paid, if shown
- Buyer premium or platform fee (USD), auction house premiums and marketplace seller fees, if disclosed
- Net to seller (USD), sale price minus fees, plus or minus shipping; this is the number that reflects realized value
- Grade, the numeric grade (for example, 9.4) or a raw condition descriptor (NM, VF, FN)
- Raw or slabbed, and the grading company if slabbed (CGC, CBCS, or PSA)
- Restoration or defect flags, trimmed, color touched, missing coupon, detached cover
- Venue, eBay, Heritage Auctions, ComicConnect, MyComicShop, a local shop, or a convention
- Auction format, auction, Buy It Now, Best Offer accepted, or private sale
- Notes, anything that explains an outlier, such as "two bidders drove this up" or "cover detached"
Here is a filled-in example row so you can see how the fields work together:
| Book ID | Title / Issue | Sale date | Sale price | Shipping | Fee | Net to seller | Grade | Raw/Slabbed | Flags | Venue | Format | Notes |
|---|---|---|---|---|---|---|---|---|---|---|---|---|
| ASM-300 | Amazing Spider-Man #300 | 2026-09-14 | $420.00 | $12.00 | $54.60 | $377.40 | 9.4 | Slabbed (CGC) | None | eBay | Auction | Two bidders, 11 total bids |
| ASM-300 | Amazing Spider-Man #300 | 2026-09-22 | $310.00 | $10.00 | $40.30 | $279.70 | 8.5 | Raw | Minor spine stress | MyComicShop | Buy It Now | , |
| ASM-300 | Amazing Spider-Man #300 | 2026-10-02 | $455.00 | $15.00 | $59.15 | $410.85 | 9.4 | Slabbed (CGC) | None | Heritage Auctions | Auction | Buyer premium included in fee |
Three habits make this log useful instead of just tidy:
- Keep grade and condition in separate columns. If you mix "9.4" and "near mint" into one field, you cannot filter cleanly later, and your comparisons will drift.
- Record net to seller, not just the headline price. A $420 sale with a 13% marketplace fee and $12 shipping nets about $377, a meaningful difference when you are comparing venues or deciding whether to sell.
- Flag anything unusual in the Notes column the same day. A bidding war, a relabeled slab, or a listing with blurry photos all change how much weight that sale deserves.
Once the log has a few dozen rows, sort by Book ID and grade. You will immediately see which books have enough comparable sales to trust and which ones are still too thin to call a trend.
Step 4: Separate Real Price Movement From Grade and Condition Changes
This is where most tracking goes wrong. If the average price of a book rises, it may be because the copies sold were in better shape, not because demand grew.
To separate the two, compare sales only within the same grade. Group your data by grade, then check whether the price moved within each group over time. A rise that shows up across several grades points to a real market shift. A rise that appears only in high grades may just reflect a few pristine copies selling.
Watch out: a shift in the mix of sales can fake a trend. If more high-grade copies sold this month, your average will climb even if no single book got more expensive.
Step 5: Calculate Trend Metrics and Check How Confident the Data Is
Once your data is grouped by grade, you can measure movement instead of guessing at it. For a broader look at valuation, risk management, and which key issues hold their value, see this comic book investment strategy guide.
1. Median sale price per grade. Sort the sales for one book and grade, then take the middle value. If you have an even number of sales, average the two middle values.
Example: Five CGC 9.4 sales of the same issue at $380, $400, $420, $455, and $1,100. The mean is $551, but the median is $420. The $1,100 sale was an outlier, possibly a pedigree copy or a shill bid, and the median tells the truer story.
2. Percentage change period over period. Take this period's median minus last period's median, divide by last period's median, and multiply by 100. A move from $400 to $440 is +10%.
3. Sales volume. Count completed sales per grade per month. Track volume as its own column in your log.
4. Volatility. A simple measure is the range, highest sale minus lowest sale within the same grade and period, divided by the median.
A confidence checklist before you act
Run every trend through these questions.
- How many completed sales support the number? Fewer than five in the same grade is thin. Ten or more is workable. Twenty-plus is strong.
- Are the grades consistent? A trend built across 8.0, 9.0, and 9.8 sales is really a grade-mix story, not a price story.
- Did one sale drive the result? Recalculate the median with the top sale removed. If the trend disappears, it was an outlier.
- Is the sample spread over enough time? Three sales in one weekend can reflect one auction house's buyer pool, not the market.
- Do two sources agree? Cross-check your log against a second venue or a price guide. If eBay and Heritage tell different stories, note the disagreement rather than picking the one you like.
- Are the listings complete? Sales with missing photos, vague grades, or "no returns" terms deserve less weight, because you cannot verify what actually sold.
Set alerts and a review cadence
Set watchlists and price alerts on the marketplaces you use for the books in your log, and review the full spreadsheet on a fixed cadence. At each review, update the medians and note any grade-mix shifts.
How to Check Comic Book Values Before You Act on a Trend
Before you buy or sell based on a trend, verify the value of the books involved. Start with completed sales for the exact grade you care about.
Check that graded books are authentic. Learn how to verify graded comic authenticity before you rely on a sale. Fake slabs and altered copies can distort your data without you noticing. Learn how to spot fake graded comic slabs before you count them.
Keep a note of how many sales you based your decision on. If you cannot find enough reliable sales, hold off. Waiting for better data costs less than acting on a bad trend.
Your Next Step: Start Tracking Your Collection This Month
You do not need a perfect system to begin. Choose one tool, log five books, and record their completed sales this week. Add more books as you get comfortable.
Scottydew Comics is a community hub for collectors, with live auctions on the Whatnot platform, exclusive bundles, and themed shows like Tuesday Night with ScottyDew and Mixed-Up Saturday. Join our community.
Frequently Asked Questions
How can I check how much a comic book is worth?
Start with completed sales rather than asking prices, because a listing only shows what a seller hopes to get. Filter for sold items of the same issue, and as closely as possible the same grade or raw condition. Look at the most recent 10 to 20 sales to see a realistic range. Record the sale price, date, grade, and whether the book was graded or raw.
Do comic book grades affect price trends?
Yes. A move from a 6.0 to a 9.0 can change a sale price far more than any market shift, so grade differences can look like a trend when they are not. Group your sales by grade before you compare prices over time. Track graded copies and raw copies separately, and note if a sale was a slab with a verified grade. Without that grouping, a price increase may only reflect a better-condition copy selling.
How often should I update my comic book price records?
Update your records at a steady cadence, such as once a week for active titles and once a month for long-held books. Frequent checks catch short-term swings, while monthly reviews show whether a trend is holding. Set a reminder and log every new sale in the same format. Consistent dating matters more than frequency, because it lets you compare like periods and avoid mixing old and new data.
How can I tell whether a comic book's price increase is sustainable?
Check whether the increase is supported by multiple completed sales at the same grade over several weeks, not one outlier. Look at sales volume, since a rise on very few transactions is weaker evidence. Compare the movement with broader activity for the title or character. If the price spike fades quickly after one or two sales, treat it as noise. A sustained pattern across a larger sample is a stronger signal.